Miyerkules, Abril 27, 2016

Gas Laws

The behavior of gas under different pressures, volumes and temperatures have been widely studied in the history of Physics. In 1662, Robert Boyle discovered that close to room temperature and at about one atmospheric pressure, the pressure and volume of gases are inversely proportional to each other and this relationship became known as Boyle’s Law. Boyle's Law is written as

where the proportionality constant CB is NkT.

Jacques Charles discovered in 1780 that close to room temperature and at about one atmospheric pressure, the volume and temperature of gases are directly proportional to each other. Known today as Charles’s Law, which is written as 

where the proportionality constant CC is Nk/P.

The Gay-Lussac’s Law states that  close to room temperature and at about one atmospheric pressure, the pressure and temperature of gases are directly proportional to each other. It was discovered by Joseph Louis Gay-Lussac in 1809 and named after him. Gay-Lussac’s Law is written as 

where the proportionality constant CG = Nk/V.

These laws can be explained if we assume that the gas is ideal. The ideal gas model is used to describe the behavior of dilute gases at low pressures and high temperatures. Many gases e.g., nitrogen, oxygen and hydrogen, can be considered to be ideal gases at room temperature and pressures close to 1 atm. Using this assumption, combining the three gas laws discuss above, which is discovered experimentally gives as the equation of the state of an ideal gas.
where P is the pressure, V is the volume, N is the number of particles and T is the temperature of the gas measured in the absolute or Kelvin scale. The constant k in the ideal gas equation is called the Boltzmann constant and has the value k = 1.3806488×10⁻²³ m^2·kg/s^2·K^1.

In this experiment, we wish to verify the Boyle's Law and Charles's Law only and  use the ideal gas equation to compute for the number of particles in the gas.

Boyle's Law

First, a beaker was filled with water up to 3/4 full and the water was boiled. The water was boiled throughout the activity. The air chamber can was then connected to the mass lifter apparatus using the rubber tubing. The air chamber can was then placed in the hot bath. The piston was lifted to its maximum height and the gas pressure sensor was connected to the Vernier LabQuest. The temperature T was monitored throughout the experiment. A 50 g standard mass was placed on the platform of the mass lifter apparatus and the height h of the piston and the pressure P was recorded. The previous step was also done for the 100,150,200 and 250 g masses.

The height of the gas in the piston where recorded. The volume of the cylinder Vcyl for each height was computed. The reciprocal P of each pressure reading was computed. Plotting  Vcyl vs P^-1 was done. 

Table B1
Table 1 above shows us that as we increase the mass of the object that we place, the height decreases and the pressure increases as well.
Figure 1
The information that we got from the linear fit equation are the following:

We obtain the volume of the chamber which is .0004 m^3, and also we can get the number of particle using the slope of the linear fit which is 1.0543E+22.

Charles's Law
The first step in this part of the experiment was to remove the beaker  (will serve as the hot bath) from the top of the stove. The air chamber was placed in the hot bath. The pressure P was monitored throughout the experiment. The temperature T of the hot bath was measured using a digital thermometer and the initial height h of the piston was recorded. Chunks of ice were slowly added on the hot bath while taking h and T measurements at equal time intervals. A graph of Vcham VS Temperature using the obtained data below. Also, the data from table 2 tells us that as the temperature decreased, the height decreased which means that the volume decreased.
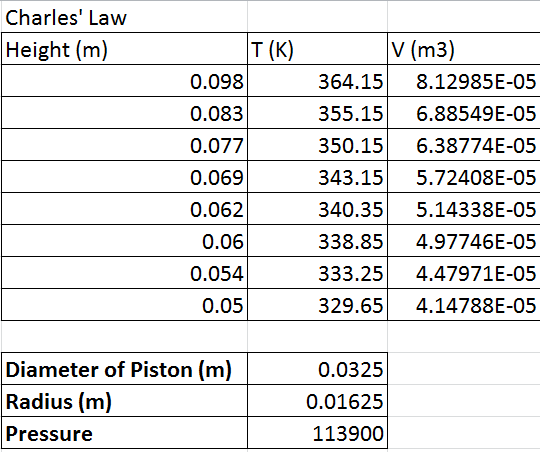
Table 2A

Figure 2
Table 2B

 The number of particles N, which is 8.2487E+21 and the volume of the air chamber can Vcham is .0003 m^3 were calculated from the slope and y-intercept, respectively.

Conclusion: The data is precise because we have R^2 = .99 on both experiment. The data on the two experiment has only small discrepancy, since the theoretical number of particles is not given, the data obtained cannot be verified if its accurate. Over all, the experiment is well done with a small discrepancy.
Reference:
1.       “Experiment 9 Gas Laws,” Laboratory Manual for Physics (Physics 73.1), (2013)


Miyerkules, Abril 20, 2016

Calorimetry

The objective of this experiment is to determine the specific heat of different metal samples aluminum and copper. The amount of heat required to change the temperature of an object depends on its mass m, the change in temperature ΔT, and the specific heat capacity c. 
The specific heat capacity is an intrinsic property of an object, and depends on the material that the object is made of. For water, the specific heat capacity is 4.184 J/(g C°).

To measure the specific heat of an object, we can first heat it to some known temperature, say the boiling point of water. Then, we transfer the object to a water bath of known mass and initial temperature. Finally, we measure the final equilibrium temperature of the system (the object, the water in the bath, and the water-bath container). If the system is thermally isolated from its surroundings (by insulating the container, for example), then the heat released by the object will equal the heat absorbed by the water and the container. This process is called calorimetry, and the insulated water container is called calorimeter.

A calorimeter is composed of an insulated vessel, which prevents heat released by a thermal interaction inside the vessel to escape into the surroundings. In this activity, the calorimeter consists of stacked coffee cups. The calorimeter is partially filled with tap water. The sample is then mixed into the tap water and the ΔT of the tap water is measured. If the calorimeter initially has the same temperature as the tap water, the amount of heat lost by the hot water is equal to heat absorbed by the tap water and the calorimeter: 
The experiment is split into two parts. In the first part, the heat capacity of the calorimeter will be determined.
 This information will then be used in the second part, the determination of the specific heat capacity of metal samples. 


HOT: 82 oC – 83g
TAP: 29.1 oC – 68g
Plugging in the values,
Trial 1, Tf = 56.09  => qgained-calorimeter 1318.84 J => Ccal = 48.86 J/ oC


HOT: 81 oC – 54g
TAP: 29.1 oC – 84.7g
Trial 2, Tf = 47.8,   q = 874.07  =>  Ccal = 46.74 J/ oC

HOT: 71.2 oC – 70.9g
TAP: 29.4 oC – 75.4g
Trial 3,  Tf = 48.96  q = 426.73 C =  21.82 J/ oC (dont know bakit siya lumayo maybe last trial, and naalala ko minadali na namin to kasi kukunin na yung hotplate :( )


So we get 48.86 J/ oC, 46.74 J/ oC, and 21.89 J/ oC values for Ccal. So the Ccal average is 39.14 J/ oC. Since the theoretical value is not given we don't know if our data is accurate (malamang malayo kasi di precise e).

Next part of the experiment is the calculation of the specific heat of two given metal, aluminum and copper using the computed Ccal. Unfortunately our data here are nowhere to be found (seryoso po mam) huhuhu. (may mga bagay talagang hindi nagpapaalam na mawawala kusa na lang itong maglalaho huhuhu ). The calculation for the specific heat of aluminum and copper are the same as with Ccal. Plug and play lang, given ka na ng lahat specific heat of aluminum at copper na lang yung unknown. From the experiment you can get the Final temperature and initial temperature reading and the masses. Tapos ayon plug and play na lang.

Reference
1.       “Experiment 7 Temperature Measurement,” Laboratory Manual for Physics (Physics 73.1), (2013).
2.      Tipler, P., Mosca, G. Physics for Scientists and Engineers. Chapter 25. W. H. Freeman and Company, New York, 2008.

Miyerkules, Abril 13, 2016

Temperature Measurement


  One of the interesting principal branches in physics is thermodynamics, which is study of energy transformations involving heat, mechanical work, and other aspects of energy and how these transformations relate to physical properties. Thermodynamics can study microscopically that talks about the behavior of individual atoms and molecules and the other one is macroscopically properties in bulk such as volume, pressure, and etc..
      Temperature is one of the central concepts of thermodynamics. It gauges the "hardness" and "coldness" of a system. Thermometer is the device use to measure the temperature. It works by the principle of thermal equilibrium, which means further interaction between the body & the thermometer causes no further changes. In layman's term when two objects, one warm and one cold, are placed in contact with each other, the warmer object cools while the cooler object warms up. Eventually, no more changes in the warmness or coldness would occur and they would have the same temperature.
Resulta ng larawan para sa zeroth law of thermodynamics
Zeroth Law of Thermodynamics
http://www.meritsection.com/class11/physics/thermodynamics/
      The concepts of thermal equilibrium was formally explained by the zeroth law of thermodynamics. Consider three systems A, B, and C. Also, a conductor permits thermal interactions between systems and an insulator prevents the thermal interactions between the two systems (this is an ideal insulator, in real world, an insulator also permits thermal interactions slowly). In the first picture, A&B is separated by an insulator(ideal), A&C and B&C are separated by conductor. Since, conductor permits the thermal interactions, in a time t A&C and B&C will be at thermal equilibrium. Therefore, A and B are also in thermal equilibrium with each other. In the second picture says that A&B will be at thermal equilibrium with each other at time t, and both A and B will not be in thermal equilibrium with C because they don't have any thermal interactions.

         Heat from the hotter object will transfer to the colder one until they both reach a common temperature that is different from their original temperatures. If a thermometer is placed in thermal contact with a hot body, what we actually read is the temperature of the thermometer itself! The act of touching the body with a thermometer changes the temperature of the body. It is therefore necessary that the transfer of heat to or from the thermal sensor is minimal such that it does not change the temperature of the object significantly. We have to wait until thermal equilibrium is reached before we can reliably read the temperature and it takes time to achieve this. How fast a thermal sensor achieves thermal equilibrium depends on the thermal time constant τ of the sensor.
          Consider a temperature sensor that has a reading T(t) at any time t. Initially, the sensor has a temperature T(t = 0) = Ti and is placed in contact with an object that is maintained at a constant temperature. After a sufficient time, the temperature sensor would have a final reading Tf. The difference between Tf and T(t) is ∆T(t) = Tf −T(t). As time progresses, the difference between the sensor reading and its final reading vanishes. If the sensor is a first-order linear device, the rate of change of ∆T can be assumed to be proportional to the difference of Ti and Tf,
d∆T dt = −k∆T. (1)
where k is a positive constant. The negative sign here implies that the rate of change of ∆t decreases in time. The left side of Equation (1) has dimensions [Temperature]/[Time]. To keep the dimensions the same as on the right side, the constant k must have dimensions of 1/[Time]. If we let k = 1/τ, where τ has units of time. Equation (1) becomes
d∆T dt= −∆T τ. (2)
Solving for T(t) we obtain,
T(t) = Ti + (Tf −Ti)(1−e^(−t/τ)).
        Temperature can be felt but cannot be measured directly. Instead we measure the degree of change in the properties of a material to heat and cold. For example, metals expand when heated. We can then measure how much the expansion is and equate it to a certain temperature. This and other measurable responses to heat are called thermometric properties.
        In this experiment we will using different temperature sensors and we will be interested with its thermal time constant, and this is dependent to the thermometric properties of the material.

       The experiment is divided in two procedure, the heating procedure and the cooling procedure. Basically, the two procedure is the same but will have different initial and final temperature.  First, we need a beaker or a pot with water up to 3/4 full and let the water boil. Keep the water boiling throughout the activity.  Take the thermometer and dip it in hot water. When the temperature stops increasing, record the final temperature as Tf in the worksheet. Take the thermometer and dip it in ice water. Wait for the temperature reading to stop decreasing then record it as Ti in the worksheet.  Compute the values T(τ) and tabulate in the worksheet. With initial temperature Ti, dip the thermometer in the boiling water then measure the time it takes for the reading to reach each T(τ). Record these values in the worksheet. Repeat the process three times each of the temperature sensor.

       The table above shows the data recorded from the experiment with three trials. The table above tells that the data is precise, the heating time constant recorded is 5.8 for heating and 6.0 for cooling in alcohol thermometer. Using alcohol thermometer, it takes six seconds before it reach thermal equilibrium. In simple words, approximately six seconds contact time is needed before we read the alcohol thermometer reading to be sure that its already the right temperature of the object we are measuring.

       The second table is the recorded data with three trials. Compare to the previous thermometer which is alcohol thermometer, mercury thermometer has approximately two seconds before it will reach thermal equilibrium. Therefore, mercury thermometer will have faster results compare to the alcohol thermometer. If we want to have a faster reading of the temperature we are testing it is advisable to use mercury thermometer than alcohol thermometer.
        The third table shows the data with three trials for thermocouple. The data shows that thermocouple only required approximately .2 seconds before it reach thermal equilibrium. If we want to measure a temperature with a fluctuating temperature it is better to use thermocouple because as fast as .2 second it will give you the reading of the object your trying to measure. Thermocouple has the least time constant because its operate with electric current which is very fast.

         The last table shows the time constant of each temperature measurement devices. The table shows that the thermocouple has least time constant which is .2 seconds, followed by the mercury thermometer with approximate 2 seconds and the last is alcohol thermometer with time constant approximately 6 seconds.

P.S. Hindi ko magraph yung exponential function using its equation, hindi ako makahanap ng app
kaya walang graph huhuhu

Reference
1.       “Experiment 7 Temperature Measurement,” Laboratory Manual for Physics (Physics 73.1), (2013).
2.       Walker, J., Halliday, D., & Resnick, R. (2011). Fundamentals of physics. Hoboken, NJ: Wiley.


Miyerkules, Pebrero 17, 2016

LIGO detected Gravitational Wave


Since the previous experiment talks about interference of light. Laser Interferometer Gravitational-Wave Observatory (LIGO) is a large-scale physics experiment and observatory to detect gravitational wave, it uses the interference property of light to detect a very small change of length. And YES!!! they detect it, for more info here is the link of the paper


Laser Interferometer Gravitational Wave (LIGO)
photo from:www.ligo.caltech.edu

Interference and DIffraction

Introduction
The wave-particle duality in light states that matter and light exhibits the behaviors of both waves and particles, depending upon the circumstances of the experiment. Certain physical phenomena are most easily explained by invoking the wave nature of light, rather than the particle nature.  Thomas Young's double slit experiment resulted in obvious wave behavior and seemed to firmly support the wave theory of light. Interference phenomena prove the wave nature of light. Interference refers to superposition of two or more waves that meet at one point in space. Waves encountering each other arise to two possibilities of formation. A condition wherein the waves combine and add up corresponds to constructive interference whereas the waves cancelling out each other correspond to destructive interference. Constructive interference occurs when two waves are in phase. To be in phase, the points on the wave must have Δφ=(2 π)m, where m is an integer. Destructive interference occurs when two waves are a half cycle out of phase. To be out of phase the points on the wave must have Δφ=(2 π)(m+½), where m is an integer. Diffraction is used to describe the interference pattern that results from a slit with no negligible width. Huygens’s principle states that every point on a wave front is a source of wavelets; light will spread out when it passes through a narrow slit. Diffraction is applicable only when the slit width is nearly the same size or smaller than the wavelength.
           
Light bends around obstacles like waves do, and it is this bending that causes the single-slit diffraction pattern. The pattern is composed of small slits, relative to the wavelength of light, with alternating dark and bright fringes visible from a screen placed far away. Most of the light is concentrated in the broad central diffraction maximum. The minor secondary bands are located at either sides of the central maximum. The first diffraction minimum occurs at the angles given the equation: sin Ɵ = ƛ / a where a is the width size. Waves passing through one of two narrow slits will diffract in passing through each slit and will result to an interference with the waves from the other slit resulting to a double-slit interference.
The objectives of this experiment are to be able to investigate the patterns produced by diffraction through a single slit, to quantitatively relate the single-slit diffraction pattern obtained to the slit width, to differentiate the patterns produced by single-slit diffraction and double-slit diffraction, to quantitatively relate the double-slit diffraction pattern to the slit width, and to determine the qualitative relationship between a double-slit diffraction pattern and the corresponding slit separation.


Methodology
The experiment was setup with a laser placed at one end of an optics bench together with a single slit disk 3 cm in front of the laser. A white sheet of paper which the light should be projected on was also attached in front of the optics bench. The room lights were turned off and the only sources of light allowed was from the laser diode and a desk lamp. The first part of the experiment was the observation of a single slit diffraction wherein a 0.04 mm width single slit was used. The laser was then turned on and lines of red light with several dark fringes were projected on the white paper. The distance between the first-order minima as well as that of the second-order minima were measured using  a rule. The obtained distances were  then halved in order to calculate the distances of each  minima from the center. The same procedure was repeated after changing the slit width from 0.04 mm to 0.02 mm. The slit width was changed to 0.08 mm but only for the observation and sketching of its diffraction pattern. Using the obtained measurements, the experimental wavelength was then calculated.
The next part of the experiment was the observation of a double-slit interference wherein the setup was still the same as that from the first part but this time, a double slit was used. A double-slit with a 0.04 mm slit width and a slit separation varying from 0.125 mm to 0.75 mm was used after which, a qualitative observation was done on its interference fringes as well as its diffraction envelope as the slit separation was varied. The slit separation was then changed to 0.25 mm. The locations of the intensity minima that was projected on the paper were marked and the distances between the first-order minima and that of the second-order minima were recorded which were then halved in order to obtain their distances from the center. 
 Using the same double-slit width and slit separation, the interference pattern was again projected on the white paper. The width of the central maximum was measured and the number of interference fringes located inside it was also counted, with the data used to calculate the approximate value of the width of each interference fringe. The same procedure was repeated but this time, the following double-slits were used:

        a=0.04 mm, d=0.50 mm
        a=0.08 mm, d=0.25 mm
        a=0.08 mm, d=0.50 mm


Set-up of the Experiment


Materials


 Results and Discussion
A.    Single-slit Diffraction

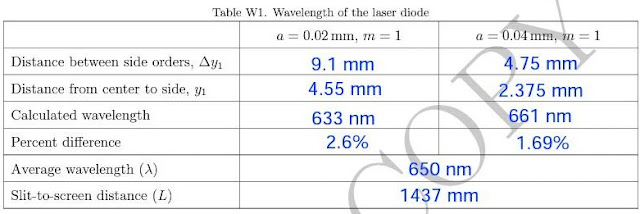
In this part of the experiment, the laser, the light source for the entire experiment, was made to pass through a single slit and project at a white surface at a fixed distance of 0.9 meters from the slit, which is the slit-to-screen distance given by L. Upon projection of the light, first passing through a single slit of slit width 0.02mm, given by a, and having the value of m equal to one, the pattern found on the surface was a series of bright and dark fringes. The bright fringes, maxima, and the dark fringes, minima, appeared fainter from the center of the projected pattern. This diffraction pattern for the single-slit is called the diffraction envelope. After the diffraction envelope was traced, the distance between the side orders, Δy1, which is the distance between the center of the first dark-fringe to the left of the central maximum and the first dark-fringe to the right of the central maximum, was measured using a ruler. The distance from the center to the side, y1, was also measured by dividing Δy1, by two. The wavelength was calculated using the formula for locating the mth intensity minimum from the center of the pattern:
                                                                       
where ym,diff in this case is y1, and lamda is the wavelength of the laser light source.1 Solving for the wavelength, the formula: 
was used. The values for Δy1, y1, and λ were also obtained for a larger slit width of 0.04mm. The results obtained are shown in the Table W1.
The wavelength of the laser light source is theoretically 6.50x10⁻⁹m. The obtained wavelength from the data table above shows that there is a 1.7 - 2.6 percent difference from the theoretical value of the wavelength that is negligible. This may be due to certain sources of error which will be discussed in the latter part of the discussion, however the measurement of the wavelength in this part of the experiment should have been consistent as the light source remained constant. The data above showed that the distance between the side orders and consequently, the distance from center to side, decreased as the slit width became larger. Consistent with the formula, the slit width in a single-slit diffraction is inversely proportional to the distance between side orders and the distance from the center to side.

Figure 1, Single-slit diffraction


A.    Double-slit Interference
In double-slit interference, a diffraction envelope is also observed combined with a series of alternating bright and dark fringes inside the diffraction envelope. The distance between the side orders, the distance from the center to the side, and the wavelength was measured with a fixed slit-to-screen distance of 1437 mm and a fixed slit width of 0.04 mm, and slit separation of 0.25 mm for the double-slit. The projected light was traced and the distance between side orders and the distance from the center to the side was measured using a ruler. The formula
which is similar in form with the previous equation, with the slit separation d. However, they are different in principle , the previous equation gives the position of intensity minima in a single slit setup, while that equation gives the position of intensity maxima in a double-slit setup.
Also, the equation also gives the width of each fringes, bright or dark.
Solving for the d or the distance between the two narrow slit
where lamda is the wavelength, L is the slit-screen distance and ym is the width of the formed fringe. The results are recorded in the TW3.

        Similar to the data from the single-slit diffraction, the distance between side orders increased proportionally as m was increased. The distance between the side orders and distance from the center to the side for a double-slit diffraction pattern is directly proportional, and the data obtained is seen to be consistent. The obtained d had a percent difference of 3.2-11.2 as compared to the theoretical, and this may have also been due to certain sources of error.

After which, the values for the slit width and the slit separation were varied and the number of fringes inside the central maximum and the width of the central maximum was measured in order to calculate for the fringe width of each fringe inside the central maximum, in which all are equal in length. The fringe width was calculated by dividing the width of the central maximum by the number of fridges. The results are shown in the data table below. 
The table W4 illustrates the trend that the number of fringes increases as the slit separation is increased. It can also be seen that the number of fringes decreases as the slit width is increased. From this, it can be said that the number of fringes is directly proportional to the slit separation and is inversely proportional to the slit width. 
Also the table W4 shows that the width of the central maximum didn’t change or exhibited negligible change when the slit separation was varied with the slit width kept constant. However, the width of the central maximum decreased when the slit width was doubled. From this, it can be said that the width of the central maximum is not affected by the slit separation and is inversely proportional to the slit width.

The calculated fringe width is seen to decrease as the slit width is increased, regardless if the slit separation is 0.25mm or 0.50mm. The calculated fringe width also decreases as the slit separation is increased. I can conclude that the fringe width is inversely proportional to both the slit width and the slit separation. 

Figure 2. Double-slit Interference (a=0.04 mm, d=0.25 mm)


Figure 3. Double-slit Interference (a=0.04 mm, d=0.50 mm)


Figure 4. Double-slit Interference (a=0.08 mm, d=0.25 mm)


Figure 4. Double-slit Interference (a=0.08 mm, d=0.50 mm)

Conclusions
Based on our data and results, the pattern produced by single-slit diffraction, called diffraction envelope, was an alternating band of bright and dark fringes, which is symmetrical over the center of the projected pattern. In the single-slit diffraction pattern, an increase in the slit width, while keeping the slit-to-screen distance and light source constant, contributed to a decrease in the distance between side orders. An increase in the value of m contributed to a proportional increase to the distance between side orders. In double-slit diffraction, the pattern was a diffraction envelope with a series of bright and dark fringes in the diffraction envelope. An increase in the value of m in double-slit diffraction contributed to a proportional increase to the distance between side orders. An increase in the value of the slit separation, while keeping the slit width constant, contributed to an increase in the number of fringes in the diffraction envelope, and an increase in the slit width contributed to a decrease in the number of fringes and width of the central maximum. Despite having attained significant percent errors for the values of the wavelength, which may have been contributed by the source of error, the results of the group observed the patterns and trends of the theoretical single-slit and double-slit diffraction. For more accurate results, it is recommended that the experiment be performed in a room well isolated from external light sources which could affect the experimental results.


References
1.       “Experiment 8 Interference and Diffraction,” Laboratory Manual for Physics (Physics 72.1), (2013).
2.       C. Colwell, “Physical Optics - Interference and Diffraction Patterns,” taken from: http://dev.physicslab.org/document.aspx?doctype=3&filename=physicaloptics_interferencediffraction.xml
3.       D. Morin, “Chapter 9 Interference and Diffraction,” Waves (to be published)

Miyerkules, Pebrero 3, 2016

Reflection, Refraction, and Total Internal Reflection


Maxwell's Equation
The experiment is all about the reflection and refraction of light, a property of light as a wave and particle. On nineteenth century, James Clark Maxwell argued that light is a traveling wave of electric and magnetic fields, or simply an Electromagnetic Wave with a speed of c= 299792458 m/s in vacuum through his four famous equations, or also known as Maxwell's Equation (Albert Einstein popularizes the name "Maxwell's Equation", in his monograph Considerations Concerning the Fundamentals of Theoretical Physics). The four equations described all electric and magnetic phenomenon and a breakthrough in the understanding of light.

In this experiment, we will study the properties of light waves -- reflection, refraction & total internal reflection -- through approximate treatment of light in which light waves are represented in straight-line rays, which is called geometrical optics.

This experiment aims to investigate reflection and refraction of light using optical disk. It also aims to know the measurement of the index of refraction of a material using the optics set-up. And lastly, the experiment wants to trace the path of light as it emerges from optical materials of different geometries.

To be able to perform the experiment, this materials are needed:


We will start the experiment by building the main set-up that will be use in the whole experiment. First, The light source and the optical disk will be mounted on the optical bench, with slit plate and parallel ray lens between them. The slit plate will produce the multiple rays and the parallel ray lens will make the multiple rays parallel. The slit plate and parallel ray lens location will adjusted in able to coincide the parallel rays with the grid of the optical disk.

In the first part of the experiment, we will do the reflection of light by plane and spherical mirror. We need a slit mask that will produce single ray and let it coincide 0°-0° axis of the optical disk. Next, the plane and spherical mirror will place on the disk such that it will coincide 90°-90° of the optical disk. Then, we will rotate the optical disk in able to have different angle of incidence.

.

Basically, in this part we will measure the the reflection of light in plane and spherical mirrors considering different angle of incidence. Also, we will verify if the plane and spherical mirrors obey the Law of Reflection, which state that the angle of incidence and angle of reflection are equal (θi=θr).
So I set 20, 50, and 80 degrees with respect to the normal line as my angle of incidence. The angle where the light was reflected were obtained and recorded in Table W1. The same procedure was done with convex and concave mirror.


We can see that the angle of incidence and the angle of reflection with respect to the normal line are equal. Therefore, we can conclude that the plane and spherical mirror obey the Law of Reflection.


In the second part of the experiment we will observe the reflection and refraction of light when it hit a transparent material and compute for index of refraction of the material. So first, we will replace the mirror with semicircular glass. Then, we will coincide the flat surface of the glass with the component axis of the optical disk and we will make sure that the center of the glass and the optical disk also coincide.


The optical disk will be rotated to set the needed angle of incidence. And lastly, the angle of reflection and refraction were obtained and recorded in Table W2.


As we can see in the data in Table W2, the angle of incidence and angle of reflection of the light with respect to the normal are equal. Therefore, we can say that glass also follows the Law of Reflection.

Comparing the data of angle of incidence and angle of refraction in Table W2, the angle of incidence is greater than the angle of refraction. Based on the data, we can say that the light bend towards to the normal line when it strike the flat surface of the cylindrical lens. This phenomenon is mathematically explains by Snell's Law:

where θ1 is the angle of incidence, θ2 is the angle of refraction and n1 and n2 is a dimensionless constant, called Index of Refraction, that is associated with a medium involved in the refraction.

In this part of the experiment we need to solve the index of refraction of the cylindrical lens using the data obtained. The data were plotted with sin θ2 vs sin θ1:


Looking at the graph, it shows that the linear equation produce by linearization is y = 0.689x that we can relate to Snell's Law in able to find and solve the index of refraction of the cylindrical lens.
Based on the computation, the index of refraction of the cylindrical lens is 1.46. Since the index of refraction of air is less than the index of refraction of the cylindrical lens, indeed the light ray bend toward the normal line.


The third part of the experiment is the somehow the same with part two. But in this part the incident ray will strike the curve surface of the cylindrical lens instead the flat surface. 

                                         \


Based on the ray diagram, the two parts differ in the which medium they refracted. In the part two of the experiment, our n1 is the air because after light ray strike the flat surface immediately the light refracted. While in this part of the experiment, the light ray go inside the glass before it refracted. In simple words, our n1 and n2 in part two is air and cylindrical lens respectively, while in the third part our n1 is the cylindrical lens and n2 is the air.

The angle of reflection and angle of refraction in this part were obtained and recorded in Table W3:

\

The data on angle of incidence and angle of reflection show that even the incident ray strike the flat or curved surface of the cylindrical lens it will still obey the law of reflection.

Looking to the data of angle of incidence versus angle of refraction, the angle of refraction is greater than the angle of incidence. We can say that the light bend away the normal line.

In order to solve again the index of refraction of the material used. We need to plot and linearize the data. It was plotted with sin(
θ2) versus sin(θ1):

Linearizing the data, it gives as a linear equation y = 1.4596x that we can relate to Snell's Law to solve for the index of refraction of the cylindrical lens.


The computed index of refraction of the cylindrical lens is 1.46, which is the same in part two. The computed index of refraction is the same because the same cylindrical lens. Since the index of refraction of glass is greater than the index of refraction of air, indeed the light ray bend away the normal line.

The last part of the experiment dealt with the total internal reflection of light. This phenomenon mostly happens when the light travel from higher index of refraction to lower index of refraction. In this part we only need to find the critical angle. We will find the critical angle by rotating the optical disk and observing the refracted ray, if the refracted ray become parallel to the flat surface of the cylindrical lens then that angle will be obtained and recorded to Table W4:


We found that the critical angle of the cylindrical lens to be 45 degrees. Using the critical angle we can solve for the index of refraction of the glass using Snell's Law:


In able to solve for the speed of light inside the semicircular glass we will use the notation of "Index of Refraction", which is needed concept to state the Snell's Law.


The computed velocity of the light inside the semicircular glass is 2.13E8 m/s. So the light slowdown inside the semicircular glass. Therefore, the higher the index of refraction the slower the speed of light inside that medium.

Conclusion:
 The data are precise, since the theoretical value is not given the percent error cannot be computed. Also, the data can't be verify if its accurate or not. Summary, the data are good and precise and there is a small discrepancy and error due to human error and machine error.


Ray tracing for plane and spherical mirror

Figure 1. Plane Mirror


Figure 2. Concave Mirror


Figure 3. Convex Mirror


 Ray tracing for different refracting media

Figure 4. Converging Lens


Figure 5. Diverging Lens


Figure 6.  Refraction of Light


Figure 7. Refraction of Light and Total Internal Reflection


References:

“Experiment 1 Reflection and Refraction,” Laboratory Manual for Physics (Physics 72.1), (2013).

"Introductory Optics System." Instruction Manual and Experiment Guide for the PASCO Scientific Model OS 850. PASCO Scientific. Web. 5 Dec. 2011.

Tipler, P., Mosca, G. Physics for Scientists and Engineers. Chapter 25. W. H. Freeman and Company, New York, 2008.

Walker, J., Halliday, D., & Resnick, R. (2011). Fundamentals of physics. Hoboken, NJ: Wiley.

Young, H., Freedman, R., University Physics with Modern Physics. Chapter . Pearson Inc. San Francisco, 2012,